Why do we need LTNs?
The hidden costs of increased car use
Private car use has risen dramatically over recent decades and adding road capacity has simply led to more of the same. It’s time for a different, proven approach to reducing traffic.
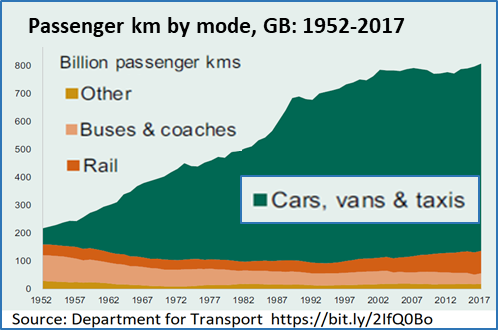
The use of private motor vehicles for personal transport has increased dramatically since records began in 1952 and this significant rise has affected different parts of our street network in different ways: our distributor roads suffer from congestion and poor air quality, while the surrounding side roads suffer from speeding and short-cutting as drivers attempt to bypass this congestion. This isn’t a satisfactory situation for any of us, regardless of where we live or travel.
We don’t always think about the costs of this significant rise in car use over the years, but this creeping increase has taken a huge toll on society as a whole, in terms of public health, congestion and air pollution.
According to a recent study, children in Oxford are suffering from the effects of roadside air pollution more than in any other UK city [4]
Find out more...
Public-health related costs
- Physical inactivity accounts for 1 in 6 deaths in the UK (equal to smoking), costing £7.4bn a year [41]; across Oxfordshire in 2017, ‘low physical activity’ resulted in an estimated 124 deaths or 2.24% of all premature deaths [42]
- It’s estimated that around 40,000 people die prematurely each year because of air pollution in the UK [43]; Oxford continually breaches European NO2 limits [44]
- Particulate air pollution accounts for 55 deaths per annum in Oxford with an average loss of 12 years per attributable death [45]
- Recent modelling by King’s College London (2019) estimates that roadside air pollution in Oxford stunts lung growth in children by 14.1% and living near busy roads within the city increases the risk of hospitalisation from stroke by 7.4% [46]
- An average of 25 children and 368 adults were killed/seriously injured on Oxfordshire roads every year from 2000-2016 (far worse than the England average) [47]
- Adverse effects of noise pollution are estimated to indirectly cost Oxfordshire more than £98m per year [48]
Costs of congestion
- Congestion costs the UK an estimated £13.1bn annually – a major concern for businesses [49a] and [49b] that adds significant costs to doing business in Oxfordshire [50]
- The average morning rush hour inbound traffic speed in Oxford in 2018 was 10.6 mph [51]
- In the first half of 2019, there were 65 days when traffic speeds on at least one route into Oxford fell to under 5 mph [52]
- Average bus speeds in Oxford have been under 10 mph since 2016 [53]
- Traffic flows across the Oxford ring road have increased by 5% since 2012; over 150,000 vehicles cross Oxford’s ring road each day – 81% are private cars [54]
Air pollution and climate change
- Poor air quality disproportionately affects pregnant women, children, older people and those with pre-existing respiratory and cardiovascular conditions [55]; 75% of local air pollution in Oxford comes from traffic [56]
- An estimated 220,000 vehicle miles are driven in and around the city of Oxford by around 45,000 vehicles every morning rush hour, emitting around 50 tonnes of CO2 [57]
- As things currently stand, the Oxfordshire Energy Strategy target to reduce emissions by 50% by 2030 won’t be met [58]
- Roadside air pollution stunts the lung growth in children in Oxford by around 14% – the highest figure of any UK city [59]